This project focused on developing an e-book / data-report about who gets raises more often in comparison to race & gender, and how to effectively ask for a raise. The design consisted of interactive elements and data visualizations to be used as a web experience.
Define and delive a compelling visual direction that communicates to both the b2b & b2c channels for PayScale while nutururing customers with meaningful data.
The content strategy team created a comprehensive transcript that contained lots of data heavy information, sections for illustrations and interactive elements.
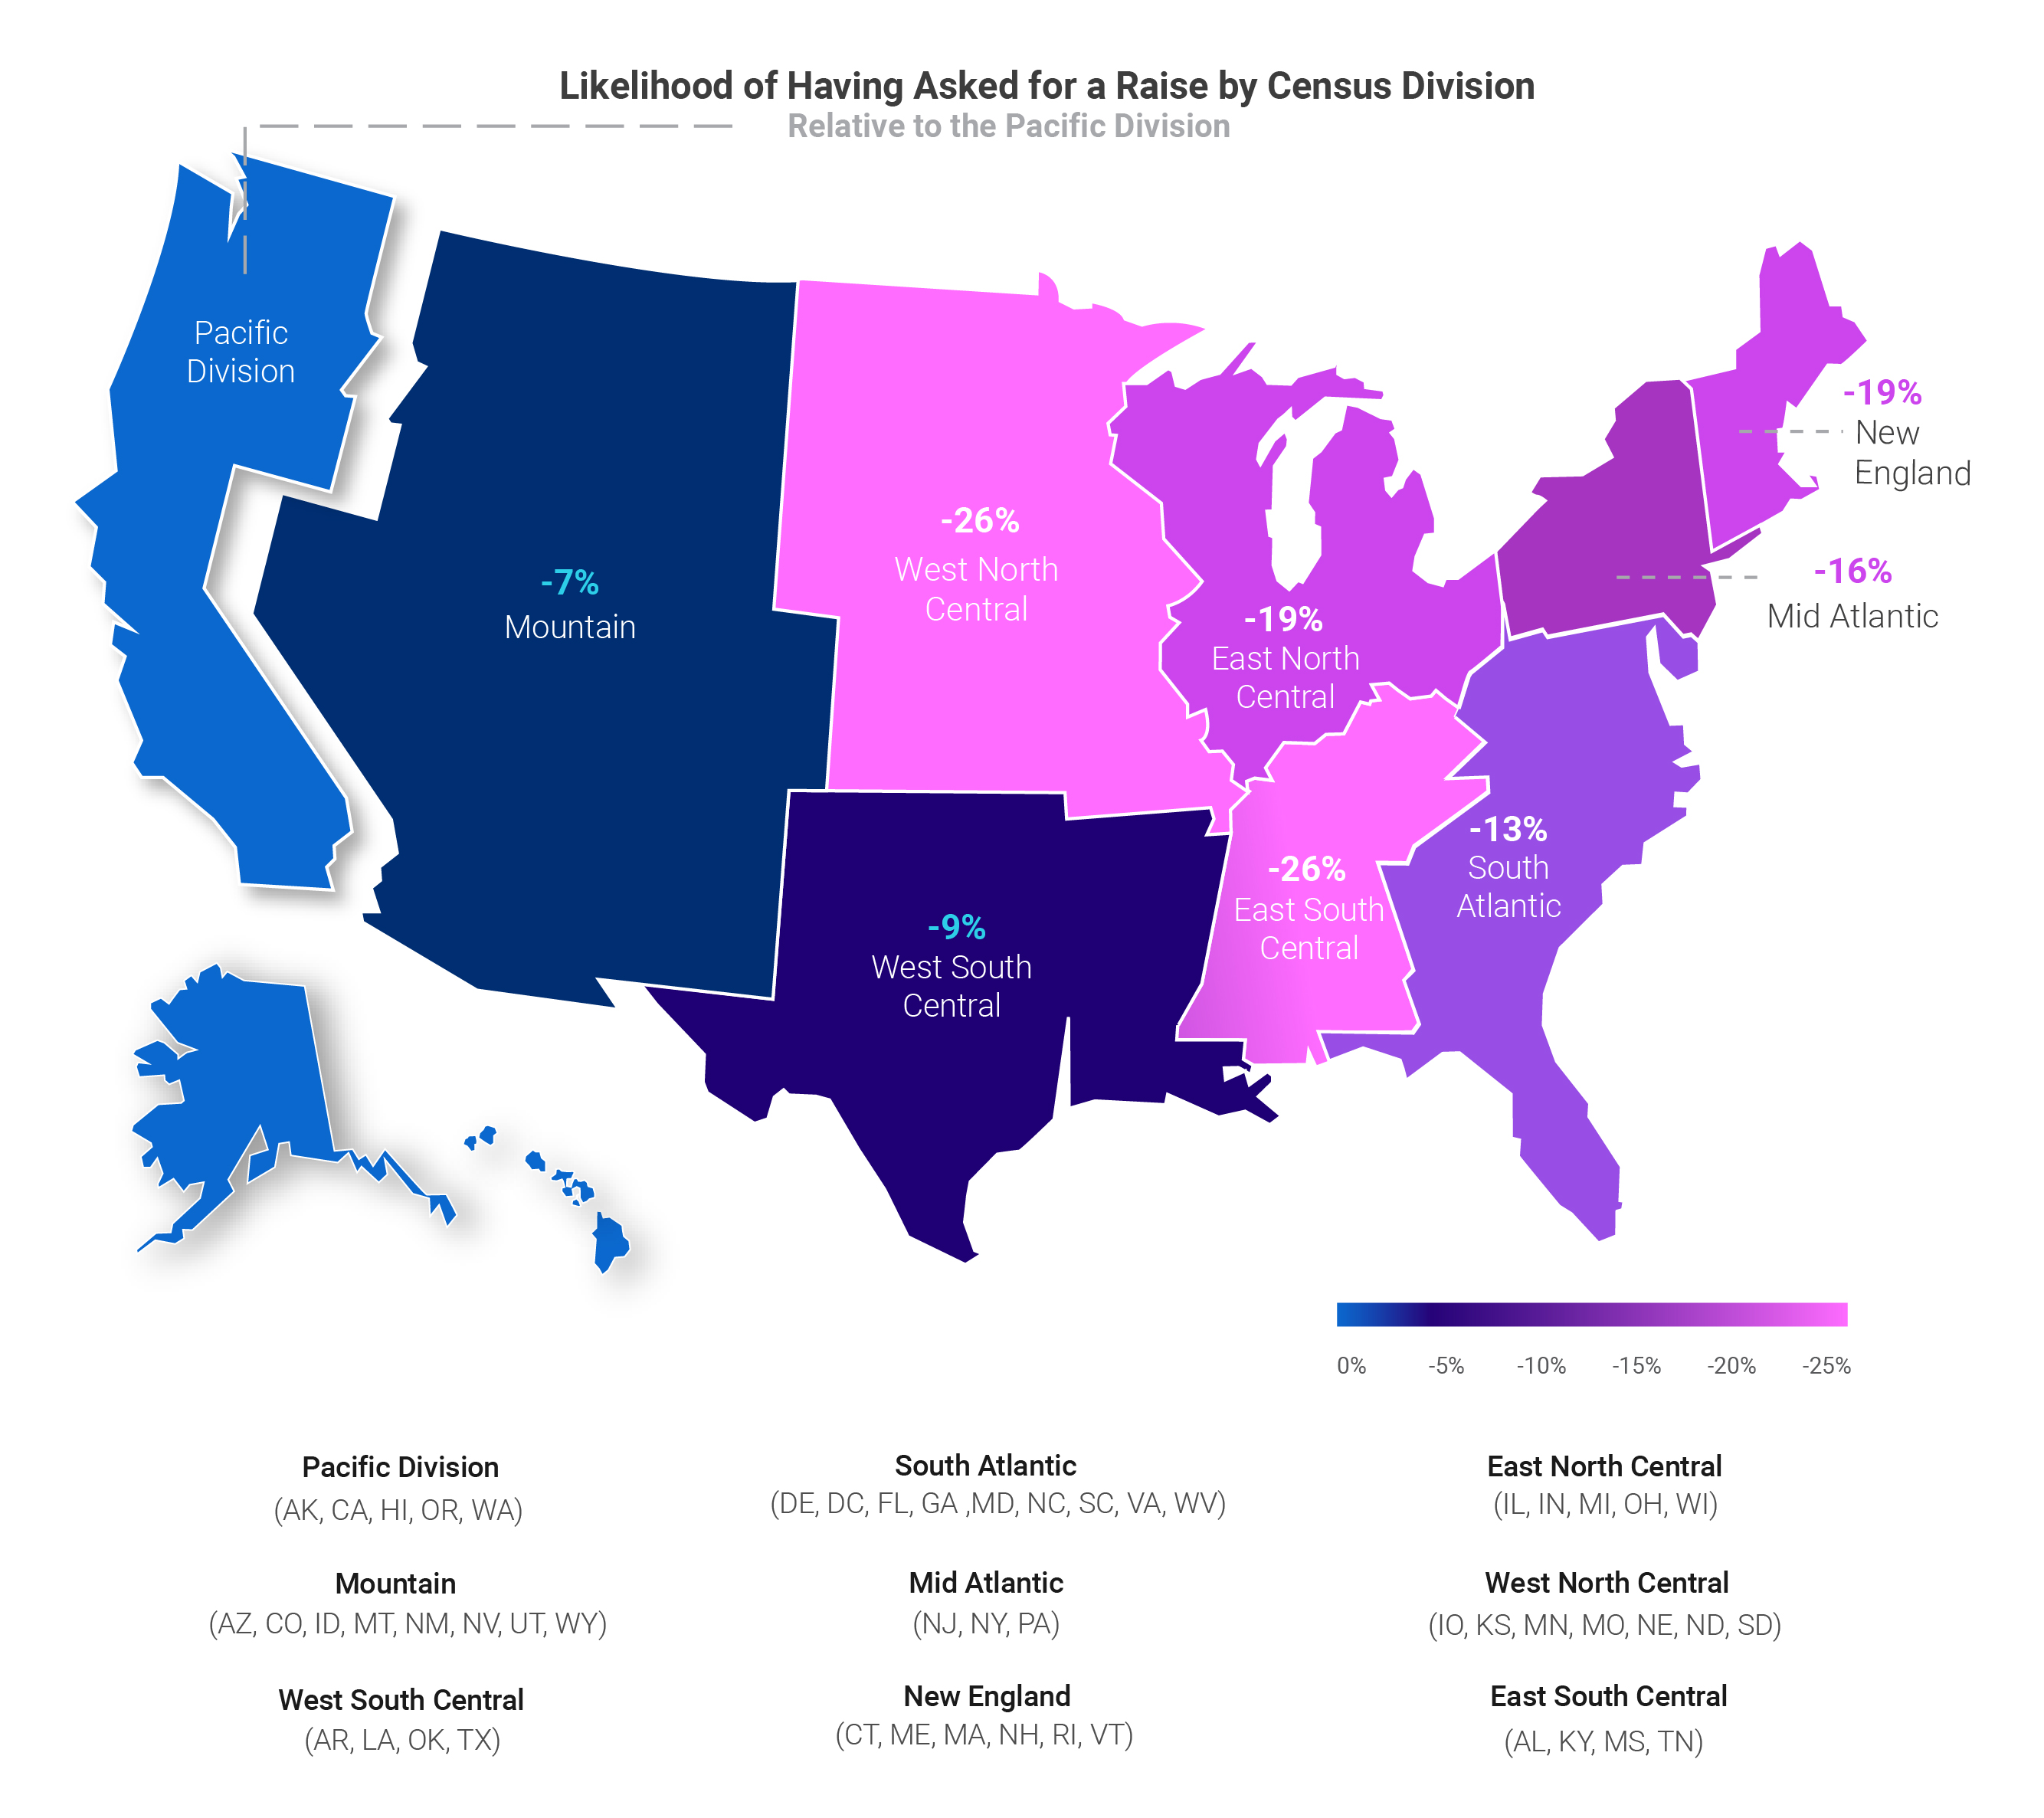
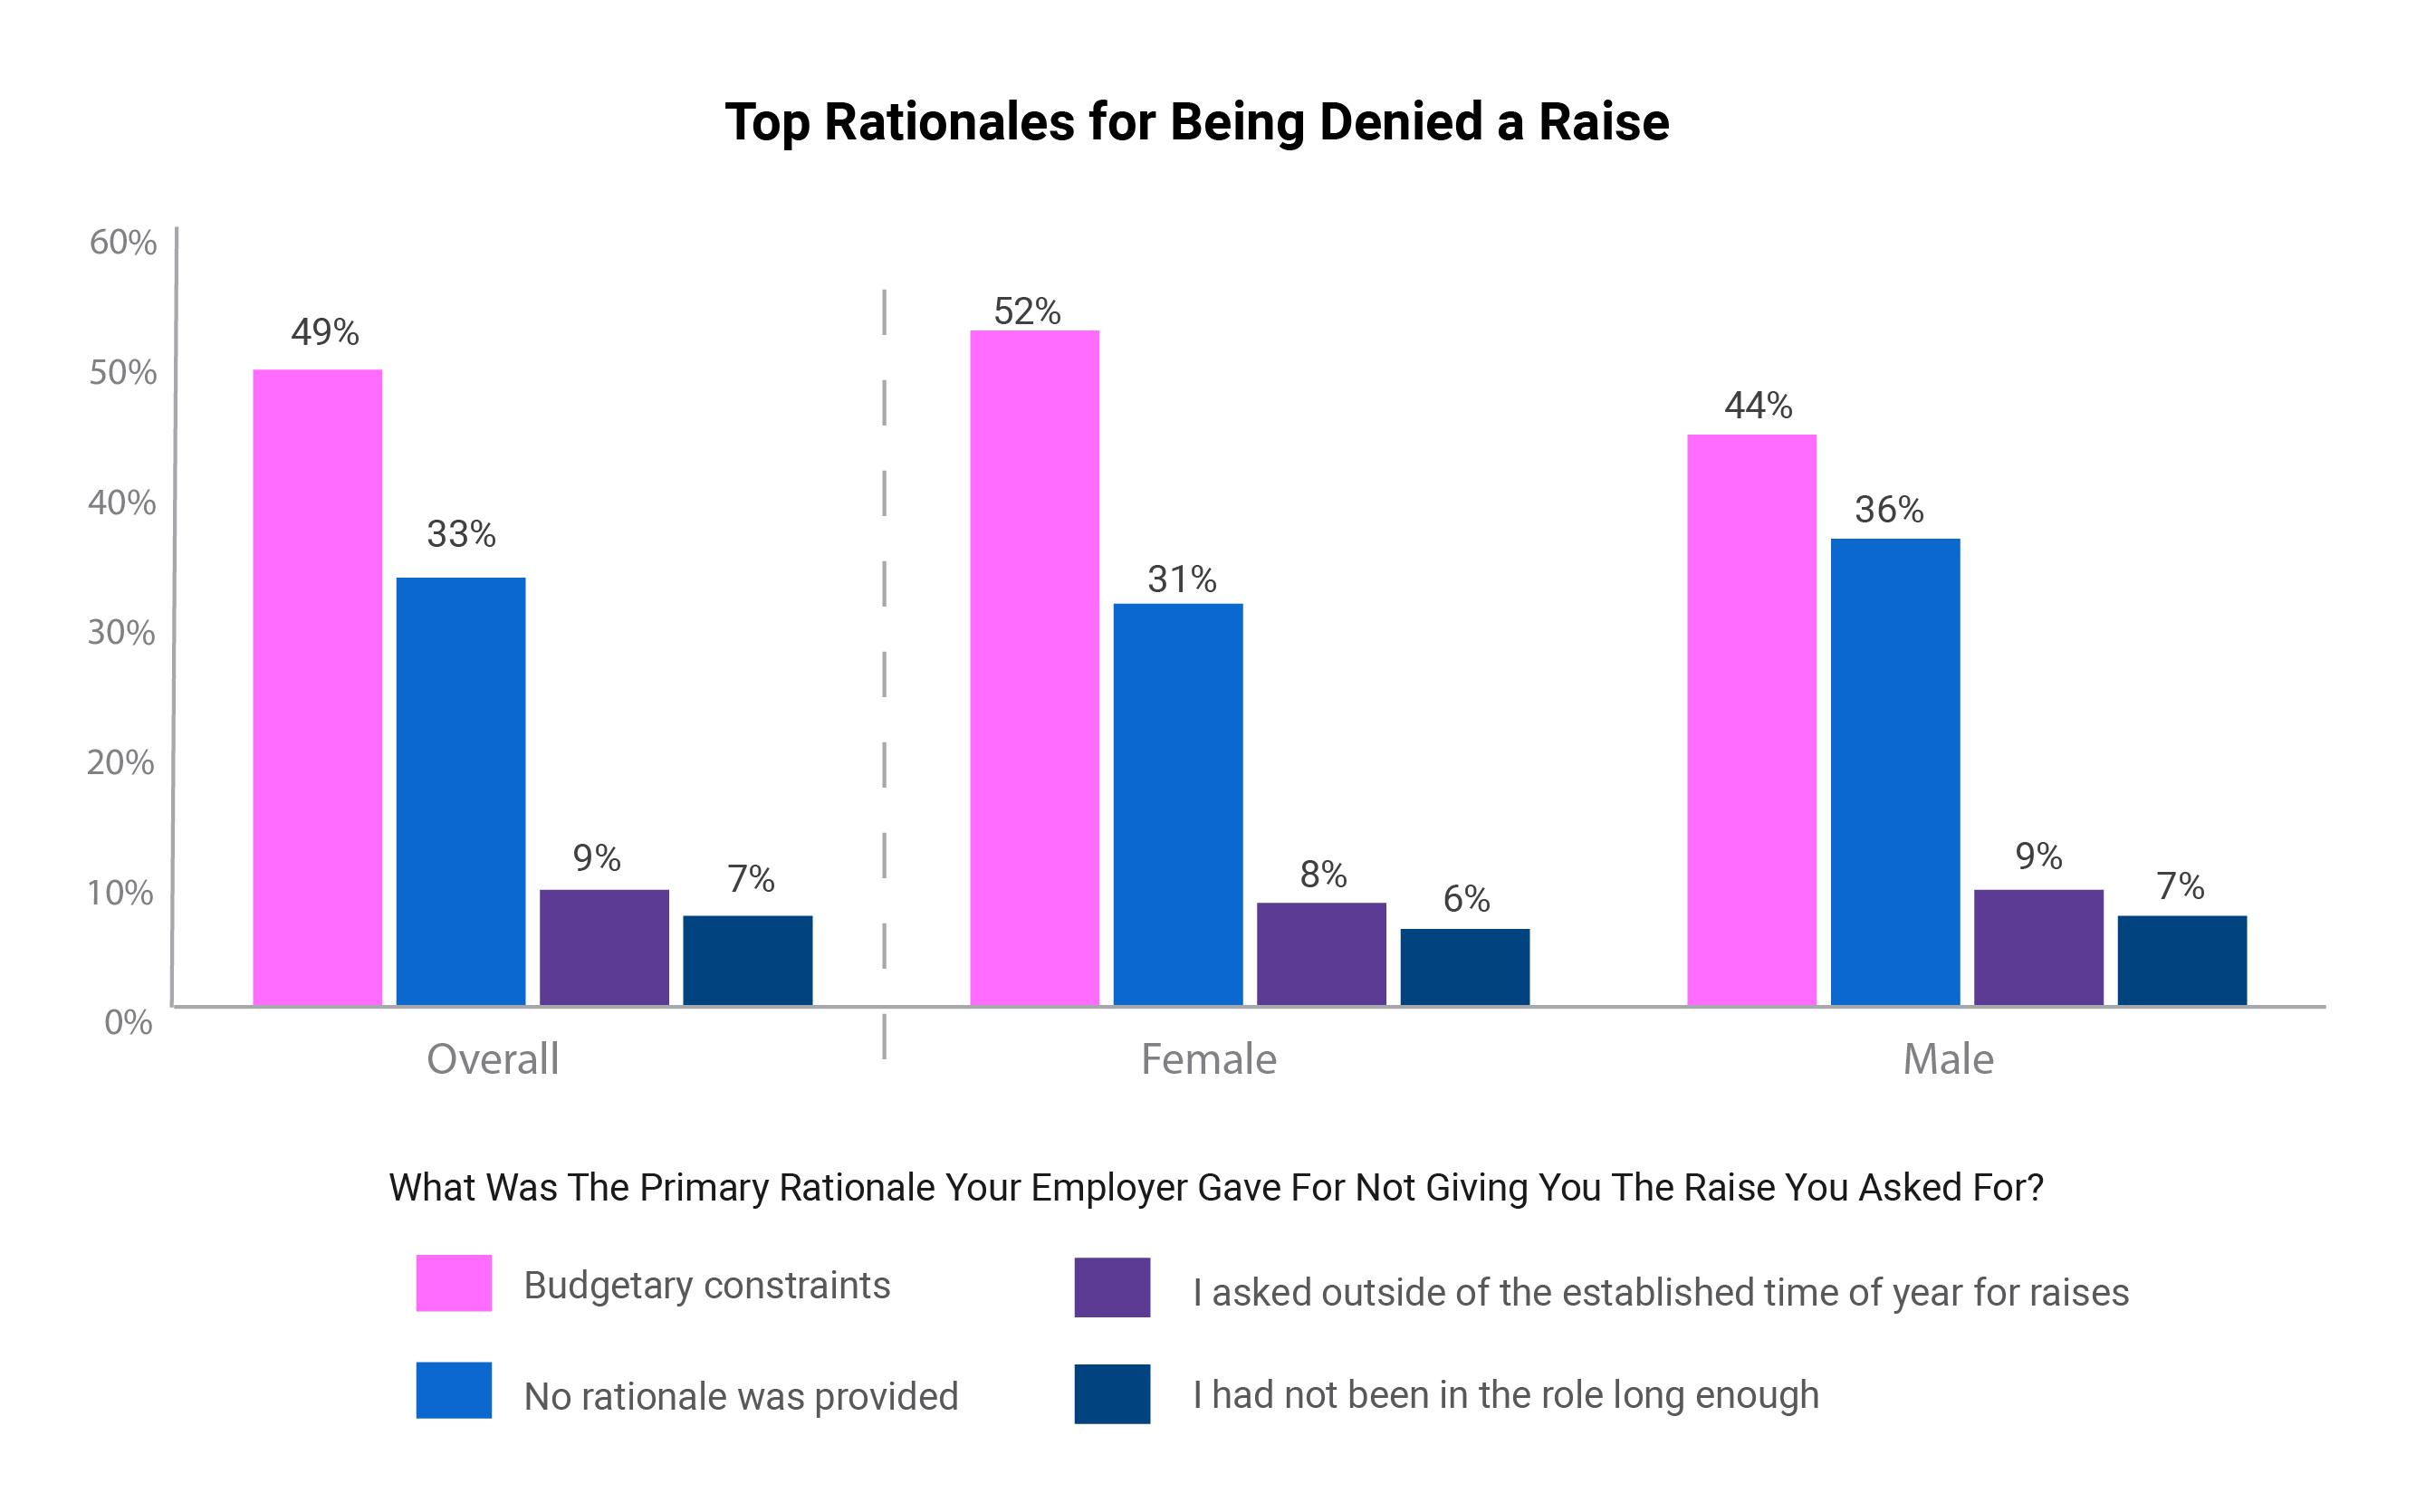
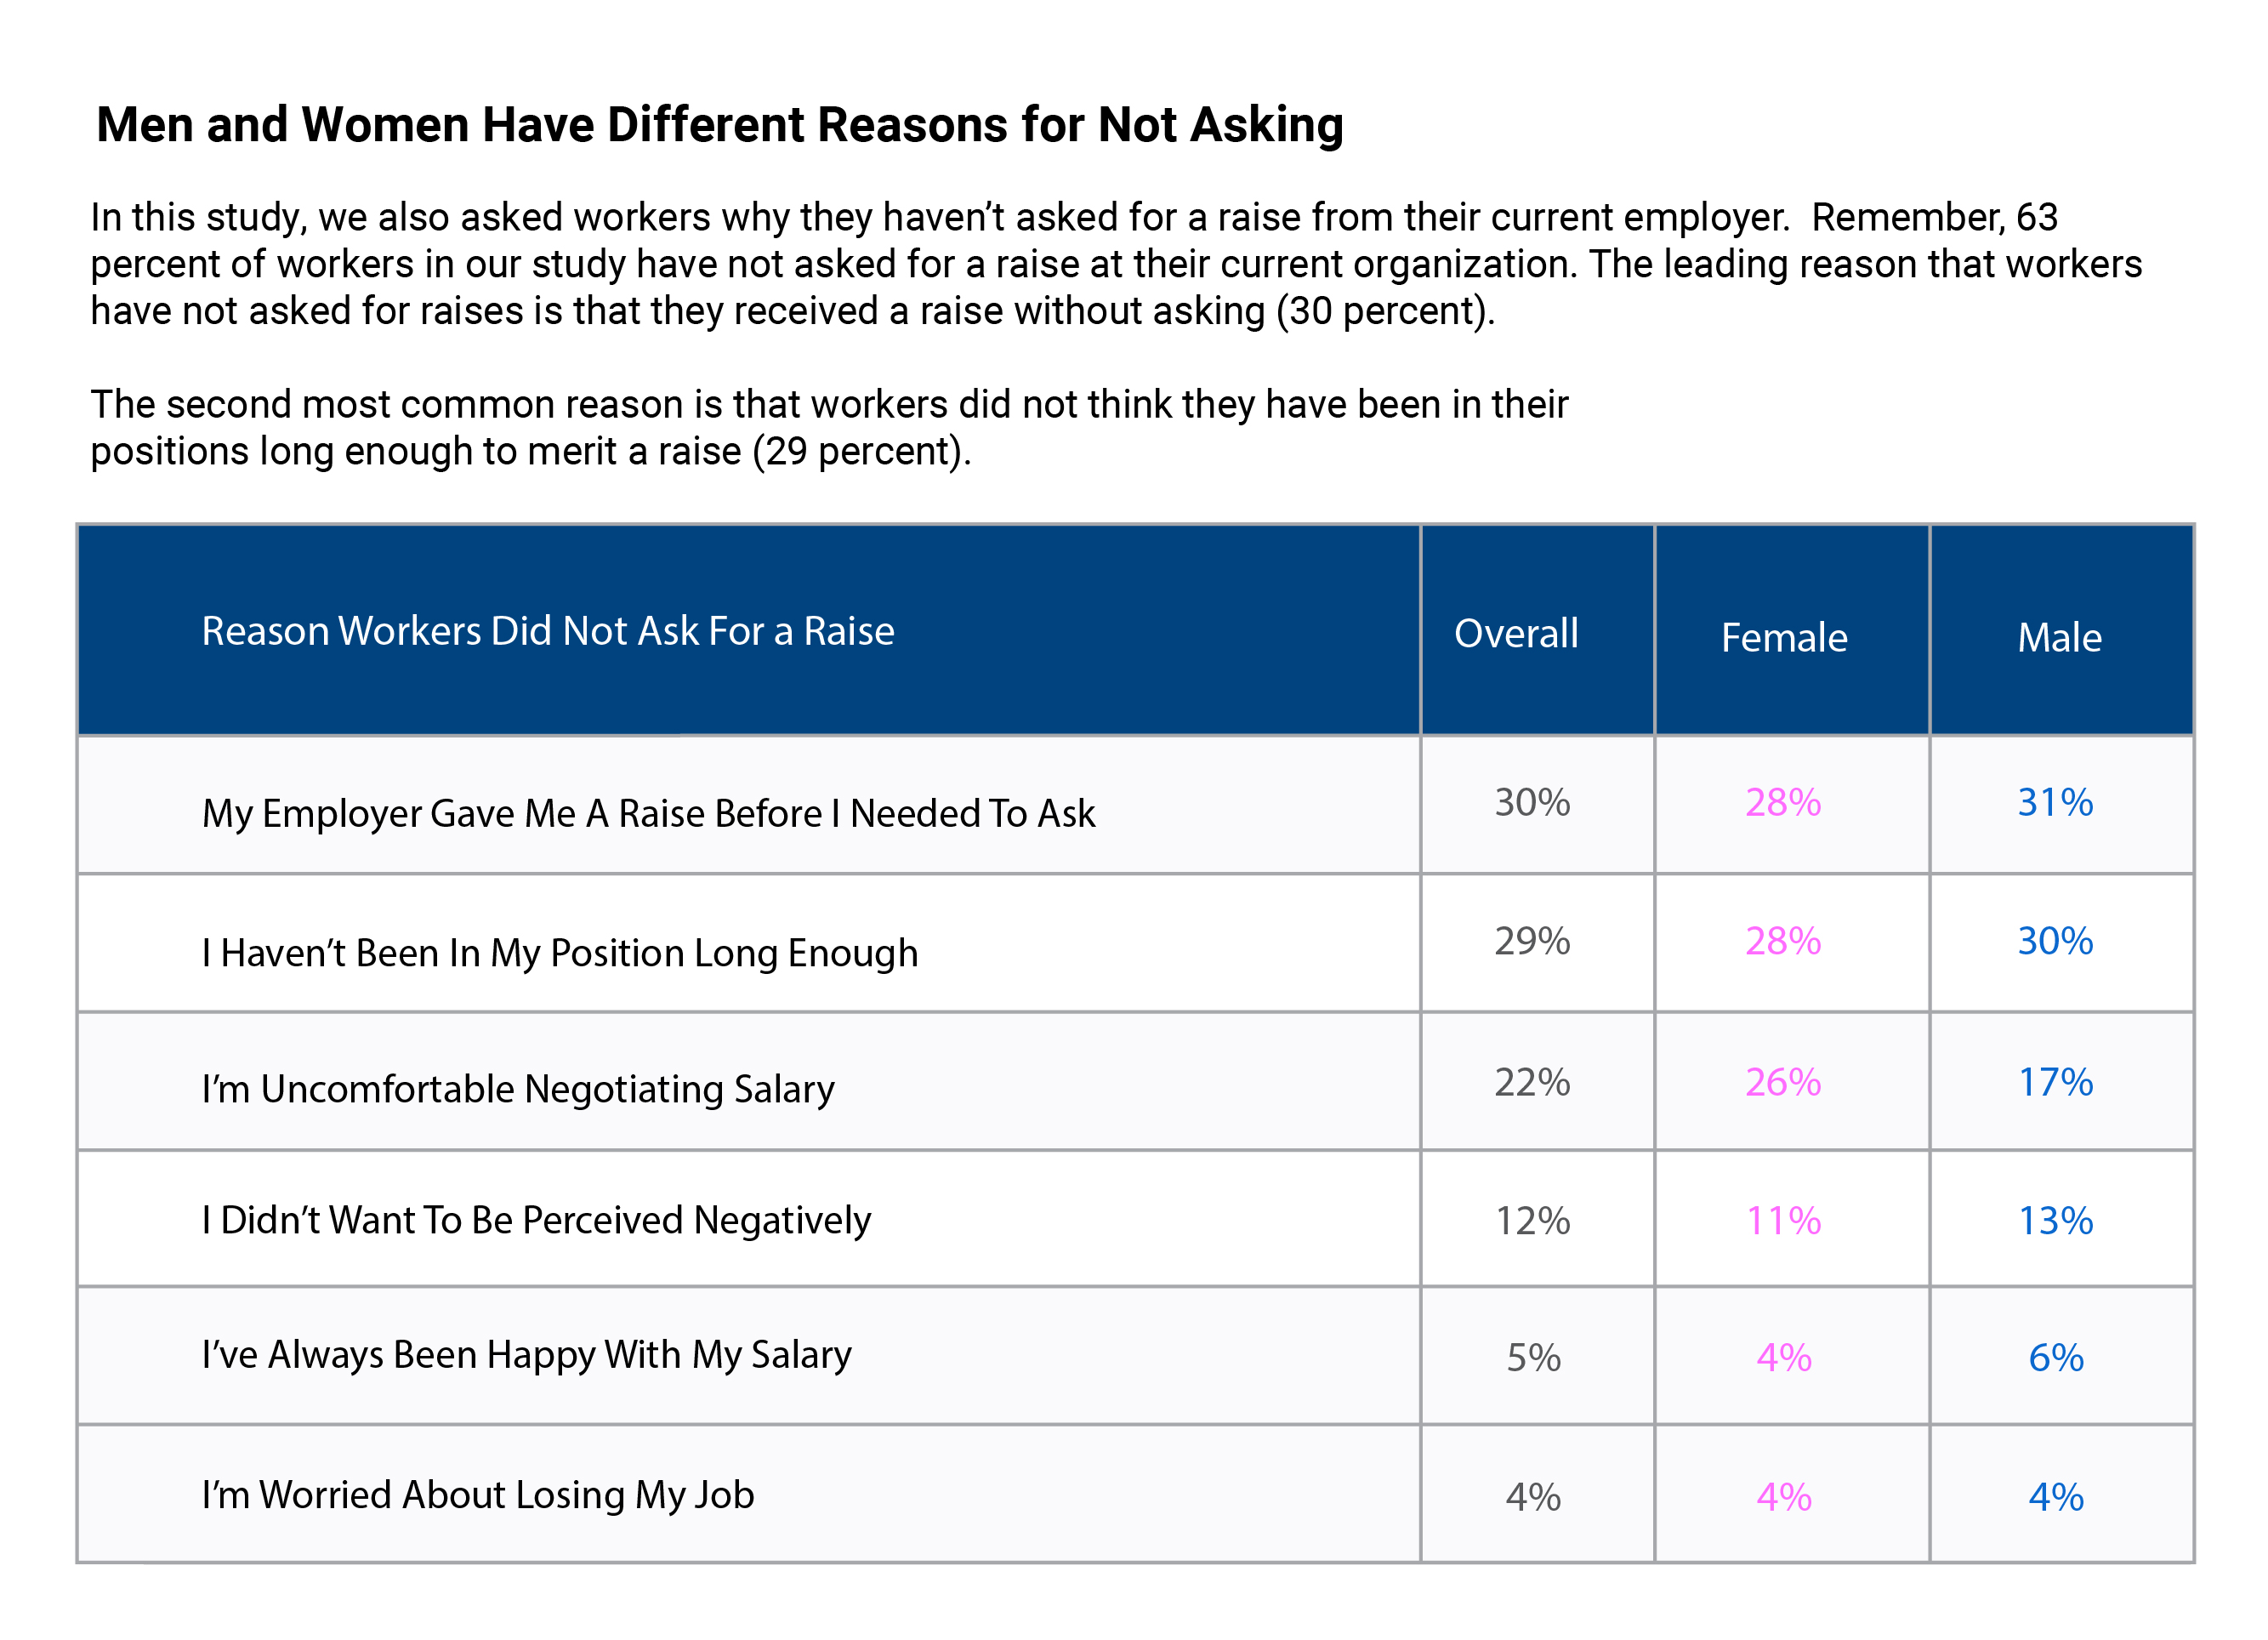
Build a rich and beautiful interactive data story.
Communicate quickly to users, and retain interest.
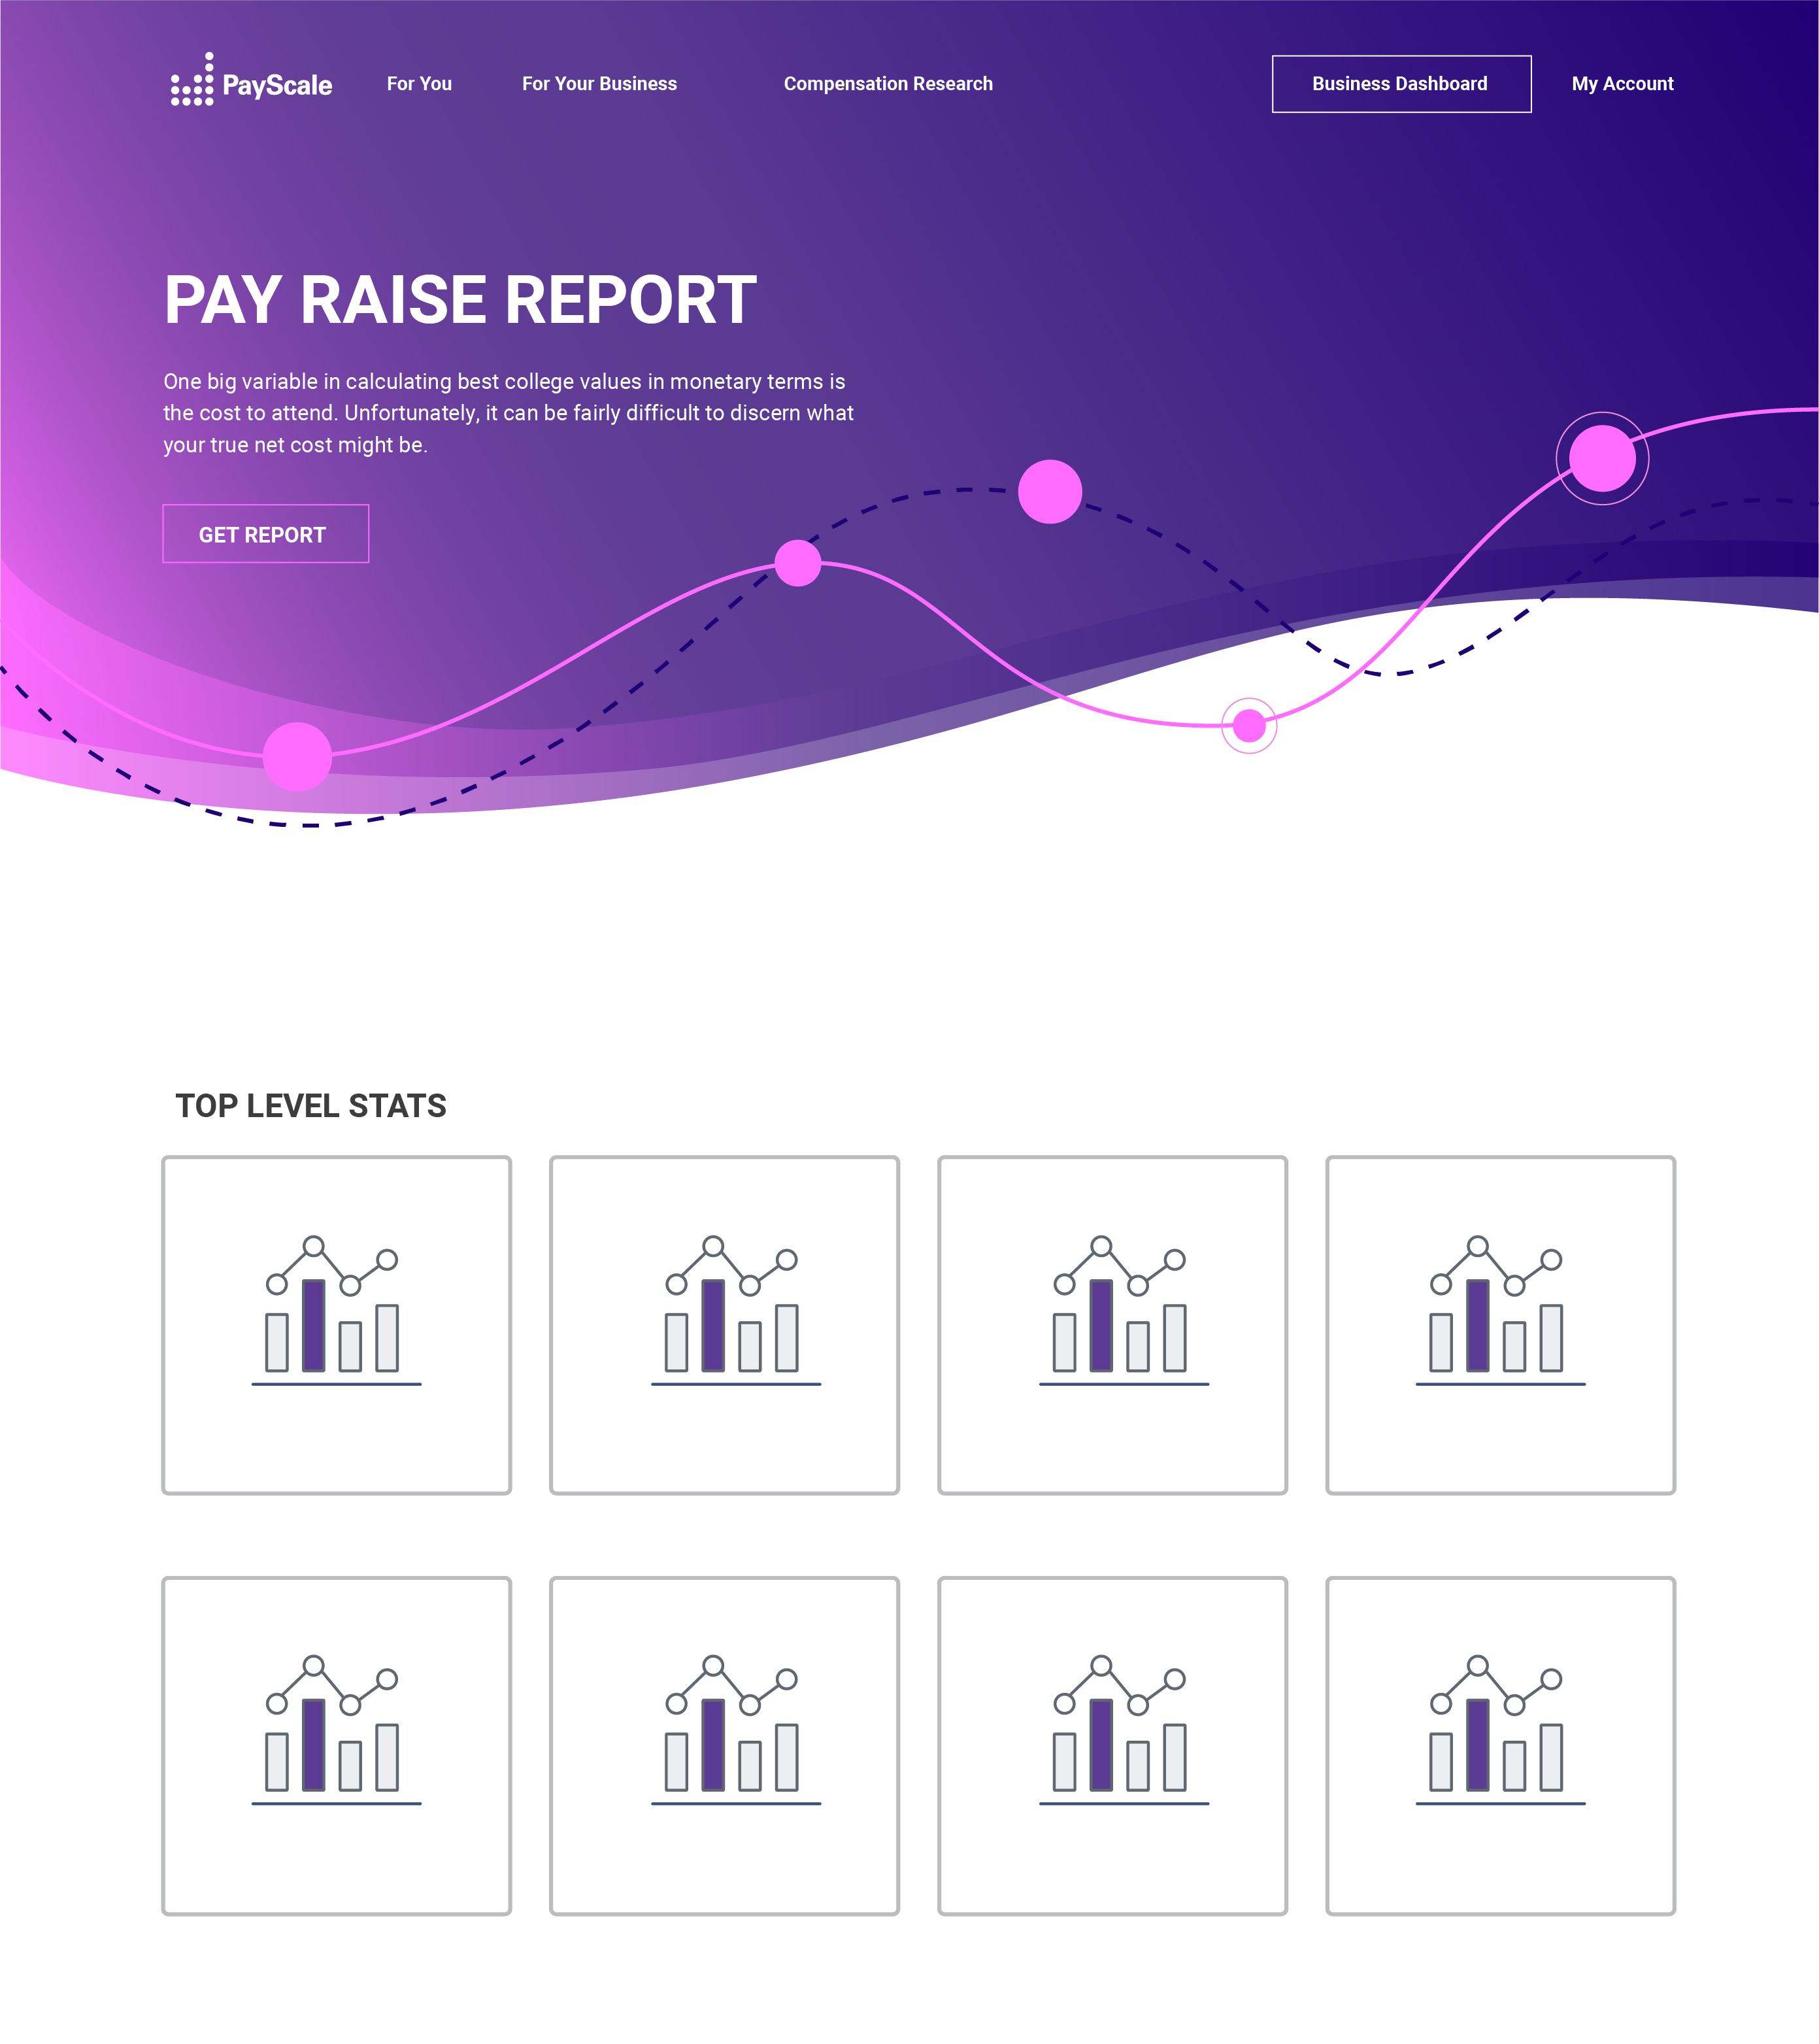
Introduce thoughful UI and simple UX.
Since the report told the story with a lot of helpful data to understand the big message, I received excel worksheets which I brought into illustrator to develop. The website has interactive versions that I used infogram to build them with.
The graphs above were developed before the web page for marketing to send them out to numerous public relations channels for promotion.
Building content sections and understanding page flow.
Sticky sub-navigation for simple and quick access.
Ensure the page met long form content benchmarks which was one of the primary goals of this design.
Allow users to discover the necessary steps in thinking about asking for a raise.
Developing the art direction to revise and iterate quickly.
Final iteration before building.
Increased web traffic overall and users were very delighted with the new tool. PayScale is still using this design today.